Why is the demand for Children’s Services rising?
This blog is the first in a new series which will attempt to highlight key trends that may help identify the causes behind the continued rise in the demand for children’s services. In this first blog, we will explore the connection between the UK labour market and the demand for children’s services, with the aim of encouraging further dialogue and debate on this topic.
It is not a secret that the rising number of children in need has placed a significant demand on public services including children’s services and social care. Between 2015 and 2016 alone, the number of children in need has increased from 391,000 to 394,400, an increase of 0.9 per cent.1 In the same period, the number of children who were subject to a child protection plan has also increased from 49,700 to 50,310, an increase of 1.2 per cent.2 Indeed, the pressure on children’s services has led to an overspend of £605 million ‘in order to protect children at immediate risk of harm’.3 This is only the most recent rise in what has been a nine-year trend, as shown in the Figure below.
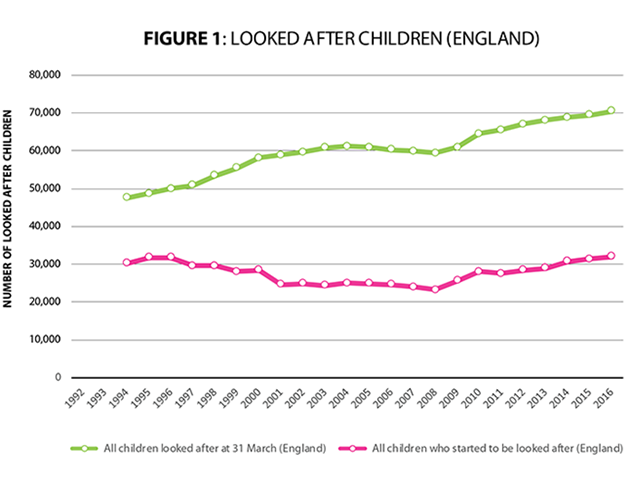
Data source: Department for Education 2017
However, there have been few attempts to explain the causes of the demand rises and most in local government either express bafflement at the causes or offer a wide variety of different explanations.
Analysis of historical data appears to suggest a lingering effect of the recession on children and families, putting sustained pressure on services. Figure 2 below which superimposes looked after children data with labour market data reveals a number of possible connections between movements in the labour market and demand for children’s services.
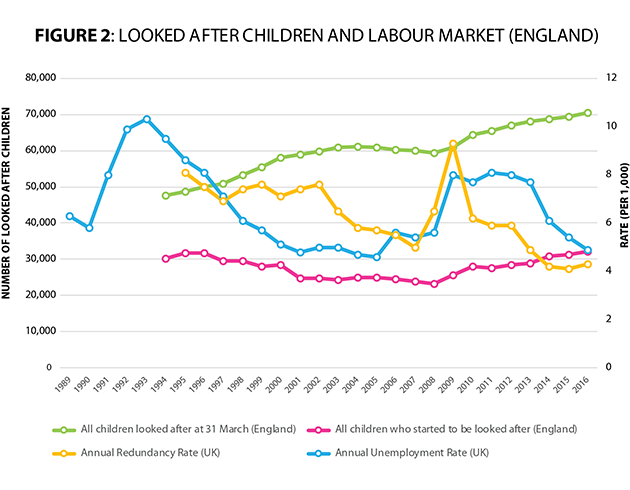
Data source: Department for Education 2016, Labour Market Survey 2017, Labour Market Trends 1996 4
Firstly and most striking is the overlap between the spike in the redundancy rate during the most recent recession and the steepest increase in the number of children starting to be looked after. The redundancy rate can be seen to have risen from pre-recession rate of 5.2 (per 1,000 employees) in 2007 to 9.5 in 2009 before falling back to 6.2 in 2010.5 During the same period, the number of children that started to be looked after – which had gradually declined in the years prior to the recession – increased from 23,960 in 2007 to 28,090 in 2010, a 17 per cent increase over three years. But the recovery in the labour market was not reflected in the same way by the number of children who started to be looked after; the latter continued to increase at an average rate of 2.25 per cent between 2010 and 2016, even after the labour market began to recover, possibly suggesting a longer-term effect of the recession on families and children.
A similar trend can be seen after the 1990s recession with the number of looked after children rising immediately following the recession. (Unfortunately, as the charts show, no consistent data on looked after children is available prior to 1994).6 Nevertheless, a lingering effect subsequent to this recession can be observed; even as the labour market recovered with the unemployment rate falling drastically at an average annual rate of 9.66 per cent between 1994 and 1999, there was a continued rise in demand for children’s services at an average annual rate of 3.11 per cent. However, unlike the 2008-09 recession, the number of children that started to be looked after dropped during the economic recovery at an average rate of 1.36 per cent annually. The rising total number of looked after children amid falling number of children that started to be looked after may suggest that children were remaining in care for a longer period of time.
Even though the 2008 recession had a less severe impact in terms of unemployment rate, it took longer for the unemployment rate to start falling. The long recession overlapped with a continued rise in the total number of looked after children and the number of children who started to be looked after between 2009 and 2016. Despite a lower-than-expected unemployment rate in the 2008 recession, there was a rise in the number of children who started to be looked after, rising at an average rate of 3.27 per cent between 2009 and 2016 (in comparison with a fall in the number of children who started to be looked after following the 1990s recession, which averaged at 1.36 per cent).
The lower unemployment rate in 2008-09 has been attributed in part to the flexible UK labour markets, which made it easier to cut hours and keep people employed on reduced working hour contracts.7 However, the effect of the recession materialised in other ways – in higher levels of under-employment, with more people reporting working fewer hours than they would like or working in a job below their skills levels.8 In these cases, income and job insecurity, as well as reduced household income continued to be a major problem for many families, with potentially detrimental effects on their living standards and family stability.
A certain time lag is usually expected before the effects of economic recovery can be felt in any public service, including in children’s services. As shown in Figure 2, it took about a decade of ongoing economic recovery following the 1990s recession for the total number of looked after children to stabilise. In fact, both the number of looked after children and children who started to be looked after even began to drop in 2005. Even though the 2008 recession was less severe based on key indicators such as unemployment rate, any effect of economic recovery on children’s services has yet to be seen today, given the continuing rise in demand nearly ten years on.
The key trends discussed in this blog may begin to point to a possible connection between the labour market and children’s services but its impact on rising demand is far from conclusive. The reasons behind rising demand for children’s services in recent years remain complex and any further investigation into this topic will benefit from a longitudinal study of other factors. Accordingly, this blog series will explore a number of relevant factors including immigration, mental health, policy change, and public spending reductions, and will engage each of these in turn.
NOTES
1 Department for Education 2016. Characteristics of children in need: 2015-2016, p. 1.2 Department for Education 2016. Characteristics of children in need: 2015-2016, p. 1.
3 LGA 2017. Children’s social care at breaking point, council leaders warn. 9 August. Available at: https://www.local.gov.uk/about/news/childrens-social-care-breaking-point-council-leaders-warn
4 Data taken from Children Looked After in England (including adoption) year ending 31 March 2016; Labour Force Survey Redundancy Rate (released 13 September 2017); Labour Market Trends, January 1996, pp. 6-7; LFS Employment Rate (aged 16 and over, seasonally adjusted)
5 No redundancy rate data is available prior to 1995.
6 According to the Department for Education, consistent data on looked after children is not available prior to the period shown due to different classifications.
7 UK Commission for Employment and Skills, 2014. The Labour Market Story: The UK Following Recession, July 2014, p. v. Available at: https://www.gov.uk/government/uploads/system/uploads/attachment_data/file/344439/The_Labour_Market_Story-_The_UK_Following_Recession.pdf
8 UK Commission for Employment and Skills, 2014. The Labour Market Story: The UK Following Recession, July 2014, p. 31. Available at: https://www.gov.uk/government/uploads/system/uploads/attachment_data/file/344439/The_Labour_Market_Story-_The_UK_Following_Recession.pdf
 Join our mailing list